Master these GPU optimization strategies to dramatically accelerate your deep learning workflows and reduce training costs without sacrificing model accuracy.
- Profile first, optimize second: Use NVIDIA Nsight Systems and nvidia-smi to identify whether your workload is memory-bound or compute-bound before applying optimizations
- Implement mixed precision training: Automatic mixed precision (AMP) delivers 1.5-3x speedup by using FP16/BF16 for most operations while maintaining FP32 for critical calculations
- Optimize batch size and data loading: Use batch sizes of 16+ per GPU and multi-threaded DataLoaders with num_workers matching CPU cores to maximize GPU utilization
- Apply quantization for inference: INT8 quantization provides 2.97x performance speedup and up to 4x memory reduction compared to FP32 with minimal accuracy loss
- Leverage gradient accumulation: Simulate larger effective batch sizes when GPU memory is limited by accumulating gradients across multiple micro-batches
These optimization techniques can deliver up to 4.5x performance improvements, transforming training times from hours to minutes while maintaining model quality. The key is systematic application based on your specific bottlenecks rather than applying all techniques blindly.
You can revolutionize your deep learning workflow when you learn how to improve GPU performance. Simple configuration changes reduced runtime from 140 seconds to 35 seconds, while detailed optimizations delivered a 4.5x performance increase without compromising model accuracy. Faster and cheaper training of these neural networks remains a high priority in AI research and development, and GMI Cloud supports this by providing optimized GPU infrastructure for both training and inference workloads. You need to understand GPUs and deep learning optimization whether you work with 8B models that require 40–80 GB of memory or scale to larger architectures.
This piece will walk you through GPU architecture fundamentals and techniques like quantization and mixed precision training. You'll also learn profiling methods to identify bottlenecks and advanced strategies like pruning and speculative decoding that help you maximize your model's performance.
Understanding GPU architecture for deep learning
How GPUs differ from CPUs for model training
CPUs and GPUs take fundamentally different approaches to processing. CPUs handle tasks one after another through a limited number of cores. GPUs break down problems into smaller components and tackle them at the same time across thousands of cores. This parallel computing architecture makes GPUs exceptional for deep learning workloads.
Modern GPUs contain thousands of processing cores. CPUs have one, two, four, or six cores. The NVIDIA A100, to name just one example, contains 6,912 CUDA cores in streaming multiprocessors. This massive parallelization becomes critical when you think about neural network training. It involves extensive matrix multiplication operations across thousands of independent calculations. Each batch processes 32 to 256 images at the same time, with millions of multiply-accumulate operations per layer.
Performance standards demonstrate this advantage. TensorFlow training on a GPU took an average of 5 minutes and 43 seconds to complete 100 epochs. The same task on a CPU required 17 minutes and 55 seconds. The GPU delivered training speeds over three times faster. This came from parallel processing capabilities that excel at handling matrix operations.
Key GPU components that affect performance
NVIDIA GPUs consist of Streaming Multiprocessors (SMs), on-chip L2 cache, and high-bandwidth DRAM. The A100 contains 108 SMs with a 40 MB L2 cache. Each SM integrates three types of specialized cores that work together. You can improve GPU performance when you understand these internal components.
CUDA cores handle general-purpose parallel computing tasks and support single-precision (FP32), double-precision (FP64), and integer operations. Tensor Cores accelerate matrix multiply-accumulate operations. The Volta architecture introduced them, and they perform multiplication and addition in a single clock cycle. These specialized units deliver up to 9x boost in mixed precision matrix multiplications. The NVIDIA H100 provides 989 TFLOPS of TF32 Tensor Core performance.
Memory hierarchy and bandwidth considerations
Memory bandwidth often determines whether your workload runs well. The A100 offers 2,039 GB/s memory bandwidth. The H100 reaches 3.35 TB/s. This bandwidth exceeds CPU memory capabilities by a wide margin and enables rapid data movement. You need this to train large models with billions of parameters.
The memory hierarchy creates a tradeoff between speed and capacity. On-chip SRAM provides fastest access but limited capacity. Off-chip DRAM delivers higher capacity with 100 times higher latency. Memory-bound operations like normalization and activation functions require 250 to 700 times less FLOPS than matrix multiplications. Yet they consumed 40% more runtime in practical workloads. This memory wall has become the main bottleneck. Model sizes have exploded while memory systems haven't kept pace with computational advances, which is why infrastructure-level optimization plays a critical role in improving memory efficiency and overall GPU performance. GMI Cloud addresses these challenges by optimizing data flow, memory access, and GPU utilization at scale.
Essential optimization techniques to improve GPU performance
Several proven techniques can improve GPU performance during training and inference. These optimizations address the memory and compute bottlenecks identified in GPU architecture.
Quantization methods for faster inference
Quantization reduces model precision from 32-bit floating point to lower bit representations like INT8. This compression shrinks memory footprint and accelerates computations since integer operations execute faster than floating-point. Post-training quantization (PTQ) applies to pre-trained models without retraining. Quantization-aware training (QAT) simulates quantization during training for higher accuracy.
INT8 quantization delivers a 2.97X performance speedup compared to FP32 inference on x86 CPUs. INT8 quantization improves throughput by 25-45% compared to standard precision modes for LLM inference on GPUs. Quantization from FP32 to INT8 provides up to 4x speed and memory improvements.
Mixed precision training with automatic mixed precision
Mixed precision combines FP16 or BF16 datatypes with FP32 and runs operations in half-precision while maintaining critical calculations in single-precision. Linear layers and convolutions execute much faster in lower precision formats. Automatic mixed precision achieved a 50% speedup in TensorFlow ASR model training without accuracy loss. AMP delivers 3X performance boost versus TF32 on Ampere GPUs. PyTorch AMP accelerated ResNet50 training by 1.5x and completed in 12 minutes versus 17 minutes for full precision.
Batch size optimization for maximum throughput
Batch size affects GPU utilization and training speed. Larger batches train faster and consume more memory but may reduce final accuracy. A batch size of 16 or more works well for single GPUs. Multi-GPU setups benefit from 16 samples per GPU to maintain full capacity. Proper batch sizing can double hardware utilization and increase training speed by 100%.
Efficient data loading with DataLoader settings
Multi-process data loading prevents GPU starvation. You can set num_workers to match available CPU cores and enable asynchronous prefetching. This hides data loading latency behind computation. Multi-threaded loading with 8 workers improved throughput by 62%. Asynchronous operations added another 23% improvement.
Gradient accumulation strategies
Gradient accumulation simulates larger batch sizes when GPU memory constrains batch capacity. Gradients accumulate over multiple micro-batches before updating weights. If you can only fit batch size 64 but need 256, accumulate over four batches. This technique enables training with effective batch sizes. This is a big deal as it means that available memory.
Profiling and monitoring GPU utilization
Monitoring tools reveal whether your optimizations improve GPU performance. NVIDIA Nsight Systems provides system-wide performance analysis and visualizes application algorithms on a timeline to identify optimization opportunities, while infrastructure platforms such as GMI Cloud complement this with real-time monitoring and performance insights across distributed GPU workloads. The tool supports low-overhead profiling of CUDA, cuBLAS, cuDNN, and TensorRT workloads. Nsight Systems exposes GPU metrics sampling including SM utilization, Tensor Core activity, instruction throughput, and warp occupancy.
Using NVIDIA Nsight Systems for performance analysis
Profile your application with the command nsys profile your_application. This generates an .nsys-rep file for detailed analysis. The GUI visualizes CPU-GPU interactions, kernel execution overlaps, and synchronization stalls. Multi-node profiling diagnoses performance limiters in data center clusters of all types automatically.
Identifying bottlenecks with nvidia-smi
The nvidia-smi command provides up-to-the-minute GPU snapshots that show utilization and memory usage. Run watch -n 2 nvidia-smi to monitor performance every two seconds. GPU utilization at 35% with 7% memory usage indicates underutilization.
Metrics to track during training
Monitor GPU utilization (percentage of time kernels execute), memory utilization (memory controller's activity), and power consumption. High SM utilization in the upper 90s signals efficient GPU usage.
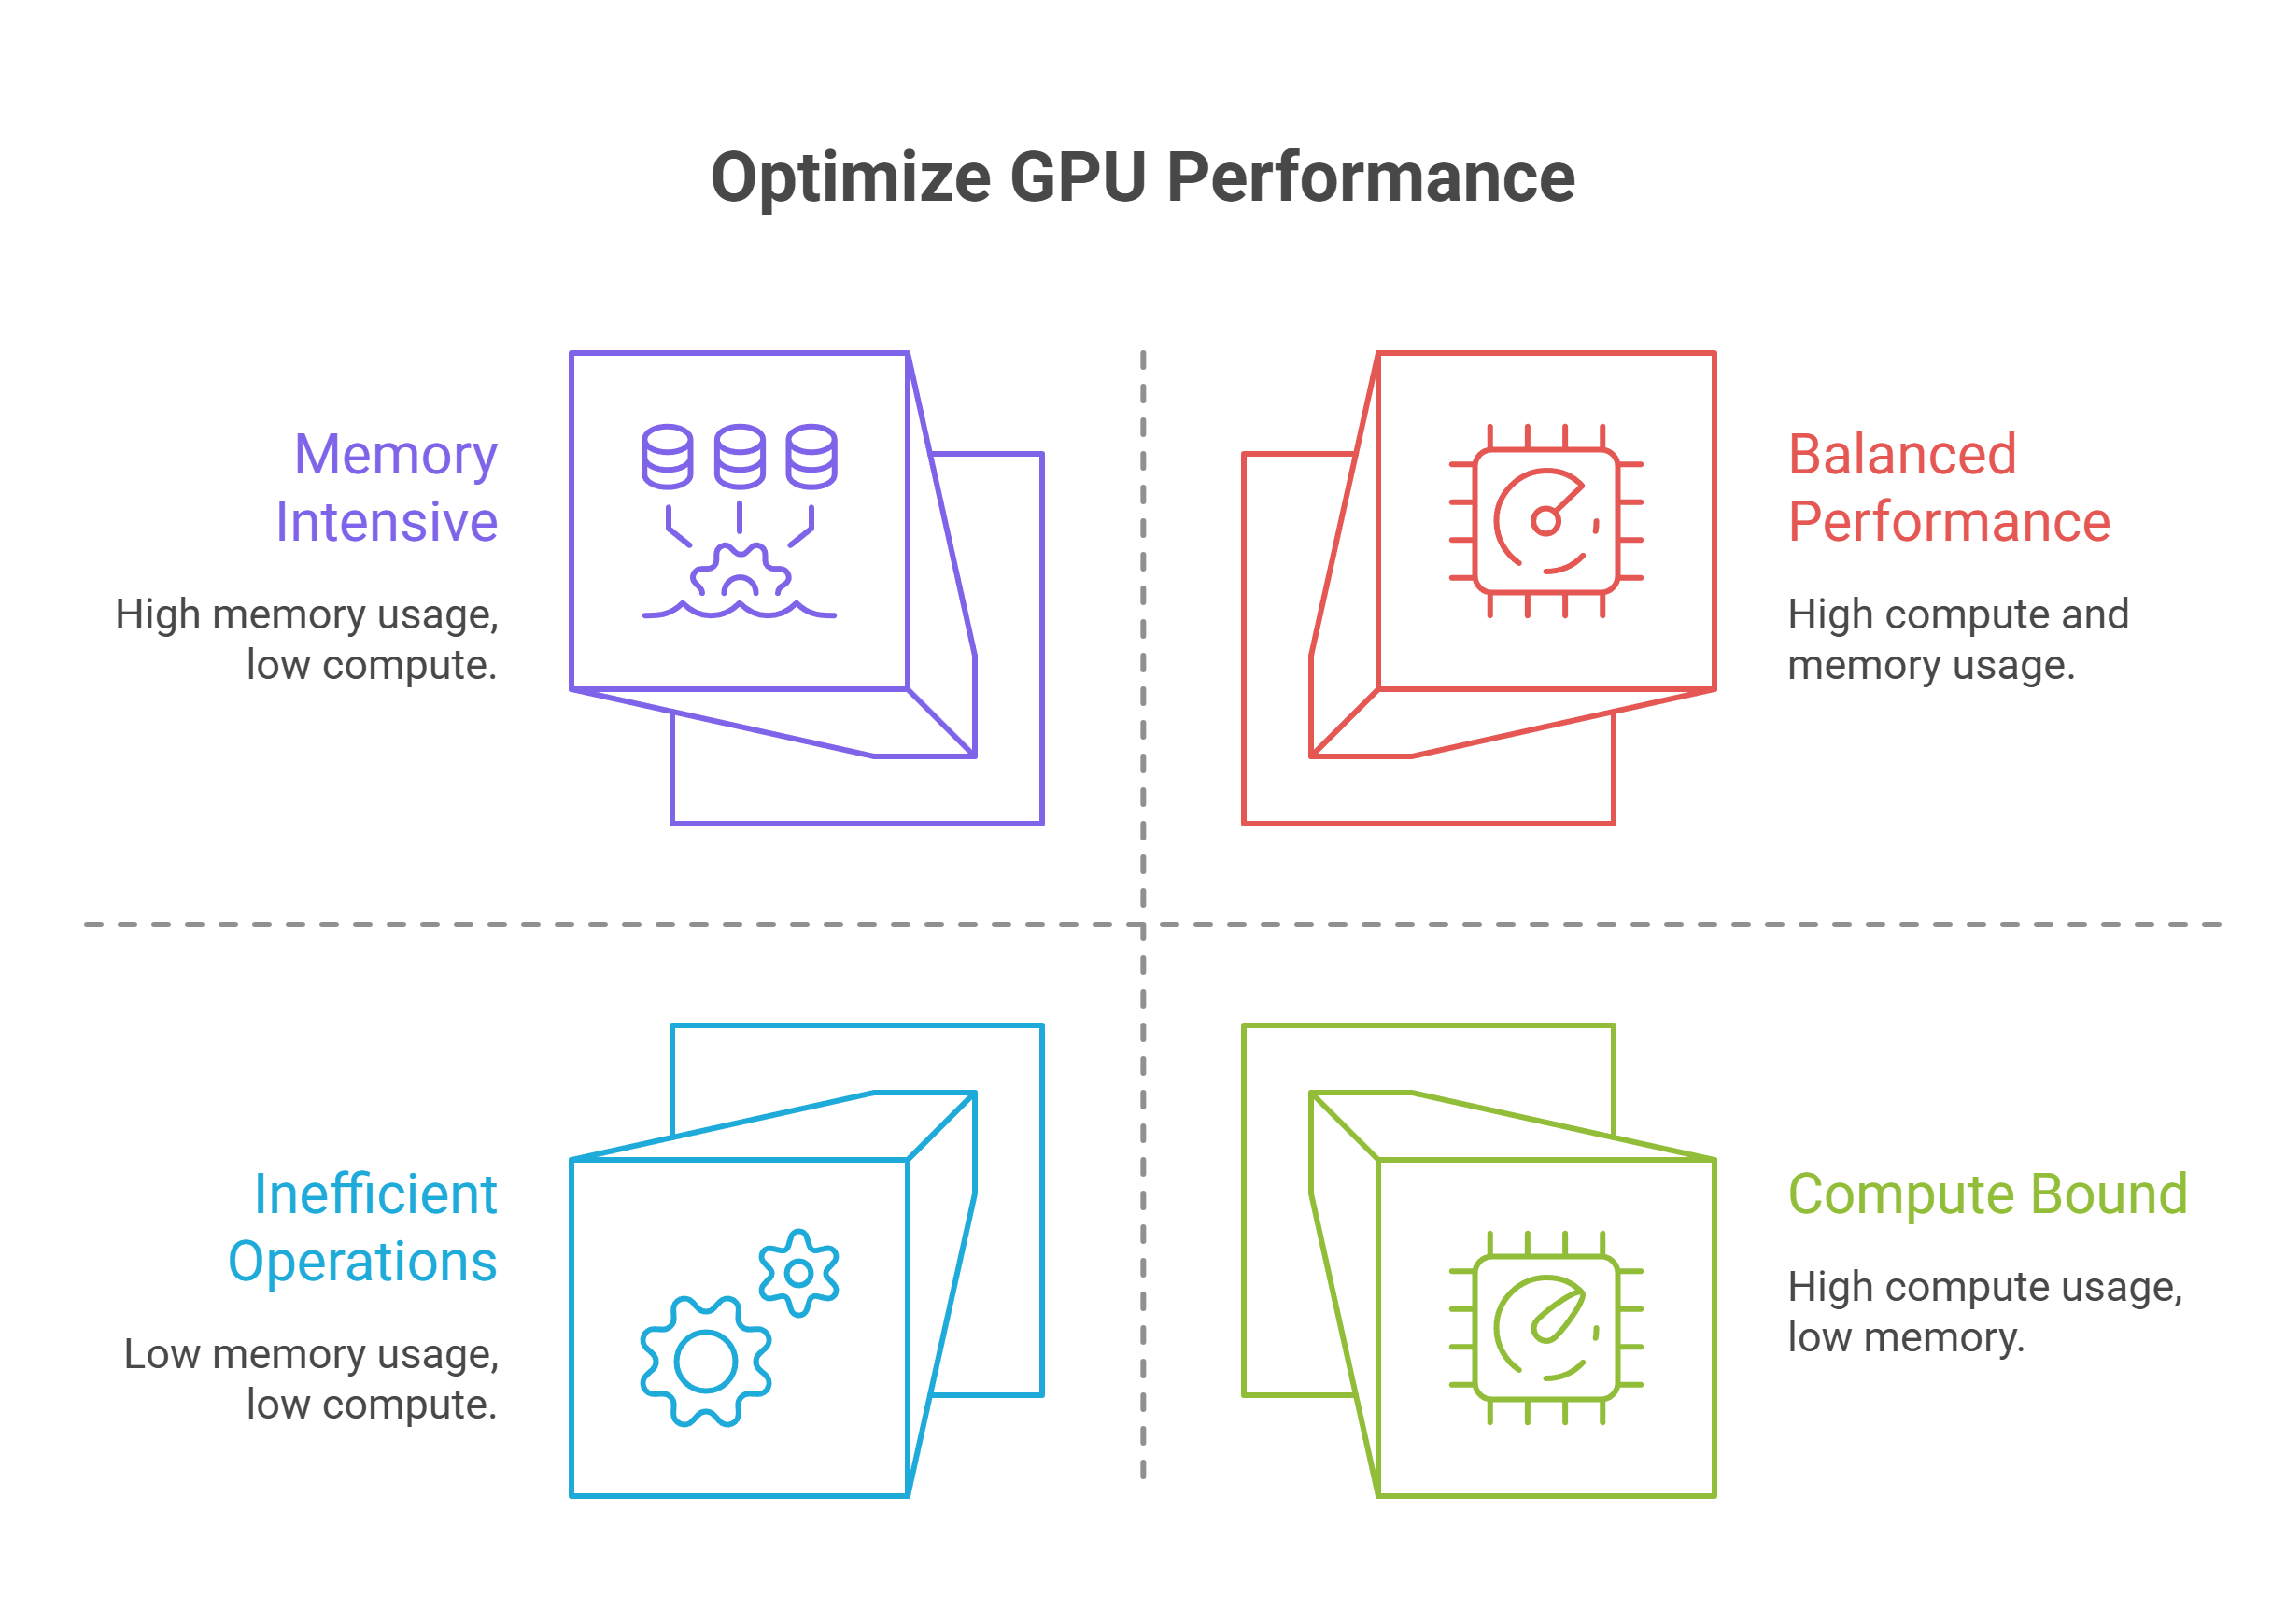
Memory-bound vs compute-bound workloads
Memory-bound kernels have lower arithmetic intensity. Bandwidth between GPU RAM and SM cache limits them. Contemporary LLM inference during decode stages remains memory-bound. Check nvidia-smi dmon -s u to diagnose: high SM utilization indicates compute-bound workloads, while high memory utilization with moderate SM suggests memory-bound operations.
Advanced model optimization strategies
Beyond foundational optimizations, several advanced strategies can further improve GPU performance for specific use cases.
Knowledge distillation for smaller models
Knowledge distillation transfers learning from large teacher models to compact student models. This approach enables training with up to 40x fewer tokens when you combine it with pruning. The technique delivers faster convergence and higher accuracy than traditional training methods. Student models learn to mimic teacher outputs and reasoning processes. They achieve comparable performance while reducing inference costs substantially.
Model pruning techniques
Pruning removes redundant parameters from neural networks. Structured pruning eliminates entire neurons or channels. Unstructured pruning zeros individual weights. Models can achieve over 90% parameter reduction and still maintain accuracy. Iterative pruning with fine-tuning yields better results than aggressive one-shot approaches in most cases.
Speculative decoding for generation tasks
Speculative decoding accelerates LLM inference by having a draft model propose multiple tokens that a target model verifies in parallel. This technique achieved nearly twice the speed for Llama2 13B chat models. Original research showed 2x-3x improvements on translation and summarization tasks.
Kernel-level optimizations
Custom GPU kernels optimize memory access patterns and parallelism for specific operations. KernelAgent achieved 2.02x speedup over baseline implementations and reached 89% of hardware roofline efficiency on H100 GPUs.
Multi-GPU and distributed training
Distributed Data Parallel works when full models fit in single GPU memory. Fully Sharded Data Parallel handles very large models exceeding single GPU capacity.
Conclusion
GPU optimization reshapes your deep learning workflow from slow and expensive to fast and budget-friendly. The techniques shared here can deliver up to 4.5x performance improvements, from simple batch sizing to advanced kernel optimizations.
Profile first to identify your specific bottlenecks. Then apply the appropriate optimizations in a systematic way. Your models will train faster and run inference more efficiently. You get better results without additional hardware investment, especially when leveraging optimized GPU infrastructure such as GMI Cloud.
FAQs
Why does my GPU show 100% utilization in Task Manager but low utilization in monitoring tools during training?
Task Manager measures any GPU activity including video decoding and desktop compositing, while specialized monitoring tools measure actual CUDA compute utilization. Low compute utilization despite high Task Manager readings typically indicates data loading bottlenecks, where the GPU finishes processing batches quickly but sits idle waiting for the next batch of data to arrive.
How can I identify if my training workload is memory-bound or compute-bound?
Use the command nvidia-smi dmon -s u during training to check utilization metrics. High SM (streaming multiprocessor) utilization indicates a compute-bound workload, while high memory utilization with moderate SM utilization suggests memory-bound operations. You can also train your model on random inputs without the data loader, if that achieves 100% GPU usage, your bottleneck is data loading rather than computation.
What's the best way to fix data loading bottlenecks that cause low GPU utilization?
Enable multi-threaded data loading by setting num_workers to match your available CPU cores, use pinned memory for faster CPU-to-GPU transfers, enable prefetching to load the next batch while the current one processes, and consider using persistent workers. If batch size is limited by memory, implement gradient accumulation to simulate larger effective batch sizes without exceeding GPU memory capacity.
How much performance improvement can I expect from mixed precision training?
ixed precision training typically delivers 1.5x to 3x speedup depending on your GPU architecture and model. For example, ResNet50 training can be accelerated by 1.5x, completing in 12 minutes versus 17 minutes for full precision, while Ampere GPUs can achieve up to 3x performance boost compared to standard TF32 precision.
What batch size should I use to maximize GPU utilization?
A batch size of 16 or more typically works well for single GPU setups, while multi-GPU configurations benefit from at least 16 samples per GPU to maintain full capacity. Proper batch sizing can double hardware
Build AI Without Limits
GMI Cloud helps you architect, deploy, optimize, and scale your AI strategies